|
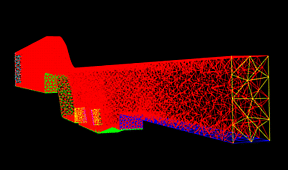
The output of a typical flow simulation is in the form of very large data files specifying the numerical results of the simulation at hundreds of thousands or millions of nodes. Converting this data into graphic images is the best way to interpret and understand the results. For our simulation, we used a commercially available visualization program named EnSight.
EnSight translates numbers into colors, lines and surfaces that
have immediate visual meaning, allowing the user to
view the domain from different perspectives, at different magnifications,
in slices, as animations, etc.
|


